
Matplotlib OER and HER Gibbs Free Energy Plotter
This Python and Matplotlib application generates publication-quality Gibbs free-energy diagrams for oxygen evolution reaction (OER) and hydrogen evolution reaction (HER) pathways. It includes a command-line plotting engine and a Windows graphical interface for importing datasets, adjusting figure appearance, previewing changes, and exporting figures.
Example outputs
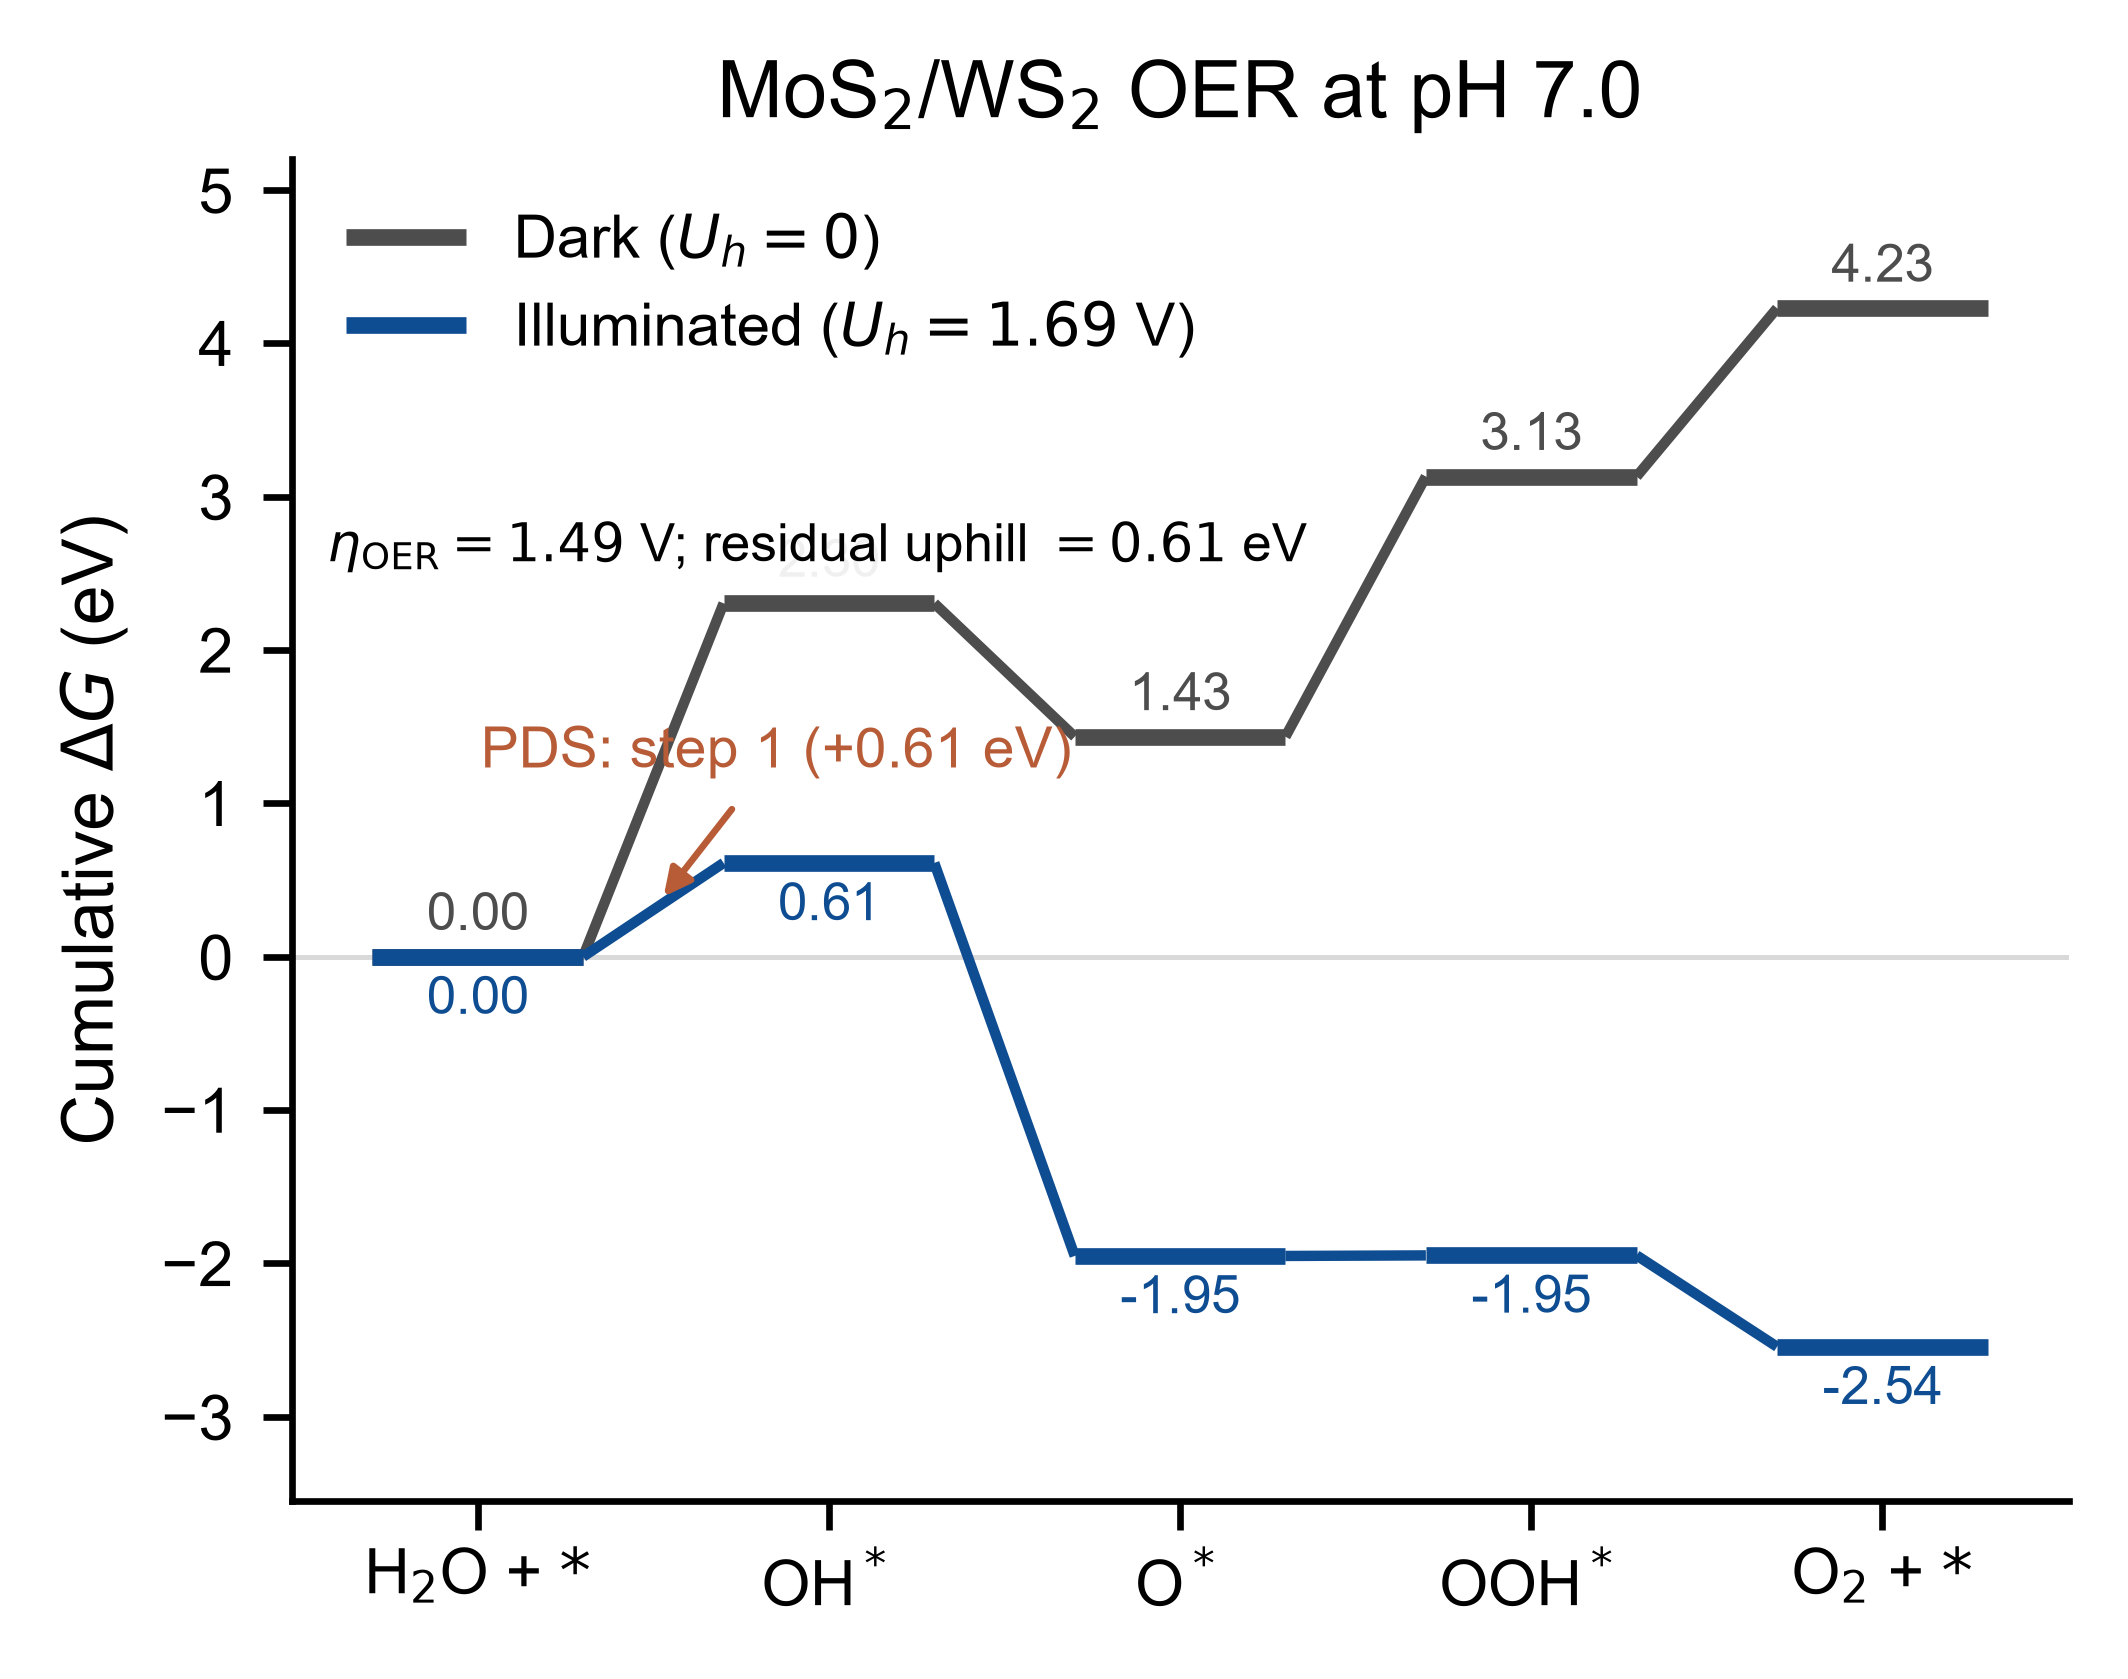
Oxygen evolution reaction
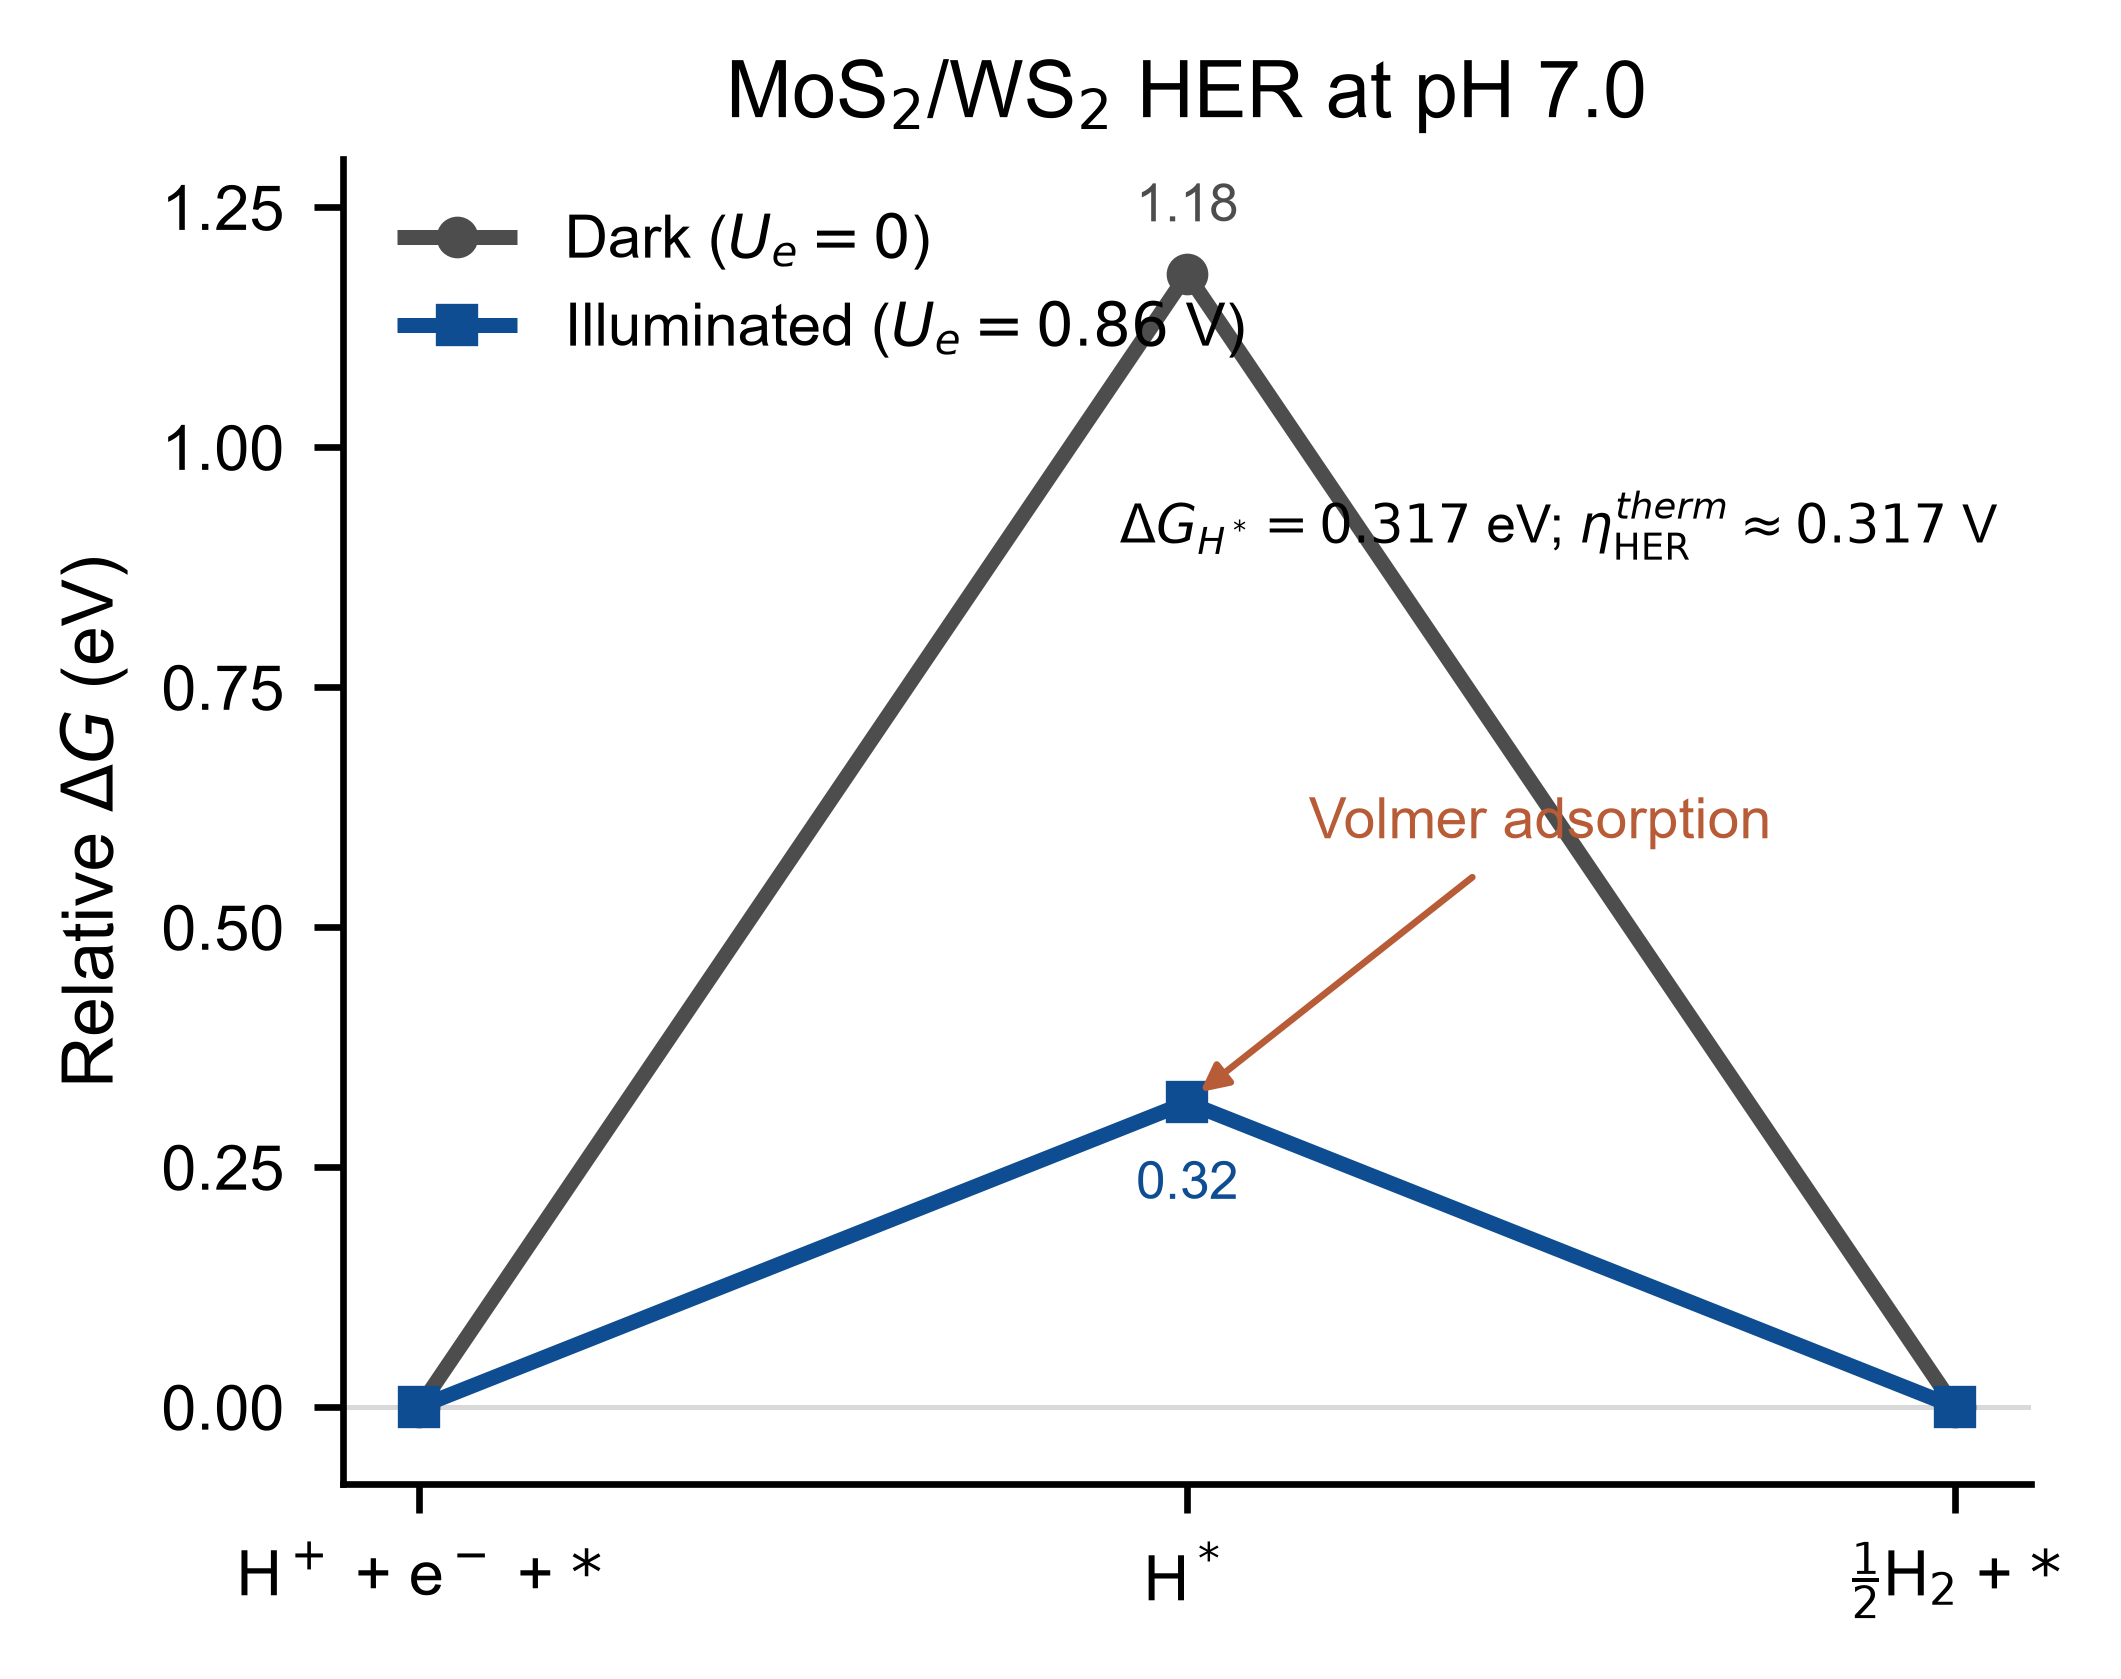
Hydrogen evolution reaction
Main features
- OER and HER Gibbs free-energy profiles under dark and illuminated conditions
- Single-panel, two-panel, and four-panel publication layouts
- CSV, TSV, TXT, DAT, XLS, and XLSX data import
- Live graphical preview with editable titles, labels, colors, axes, grids, and annotations
- Editable SVG and PDF export plus high-resolution PNG and TIFF output
- Reproducible, timestamped output folders that preserve settings and source data
Download and source code
- Download the complete Windows-ready source package
- View the plotting engine on GitHub
- View the graphical interface on GitHub
- View the data importer on GitHub
Quick start on Windows
- Download and extract the source package.
- Install Python 3.12 or newer.
- Double-click
Launch_Figure_Editor.bat. - Select a built-in or imported OER/HER dataset, adjust the figure, and export the result.
The first launch creates a private Python environment and installs the packages listed in requirements.txt.